Christian Bianciotto - 2019-04-18
I'm trying to reverse engineering the Haier T325 Cleaning Robot.
Probably this robot is produced by ILife and is very similar to the ILife V1 and to the Ariete 2711.
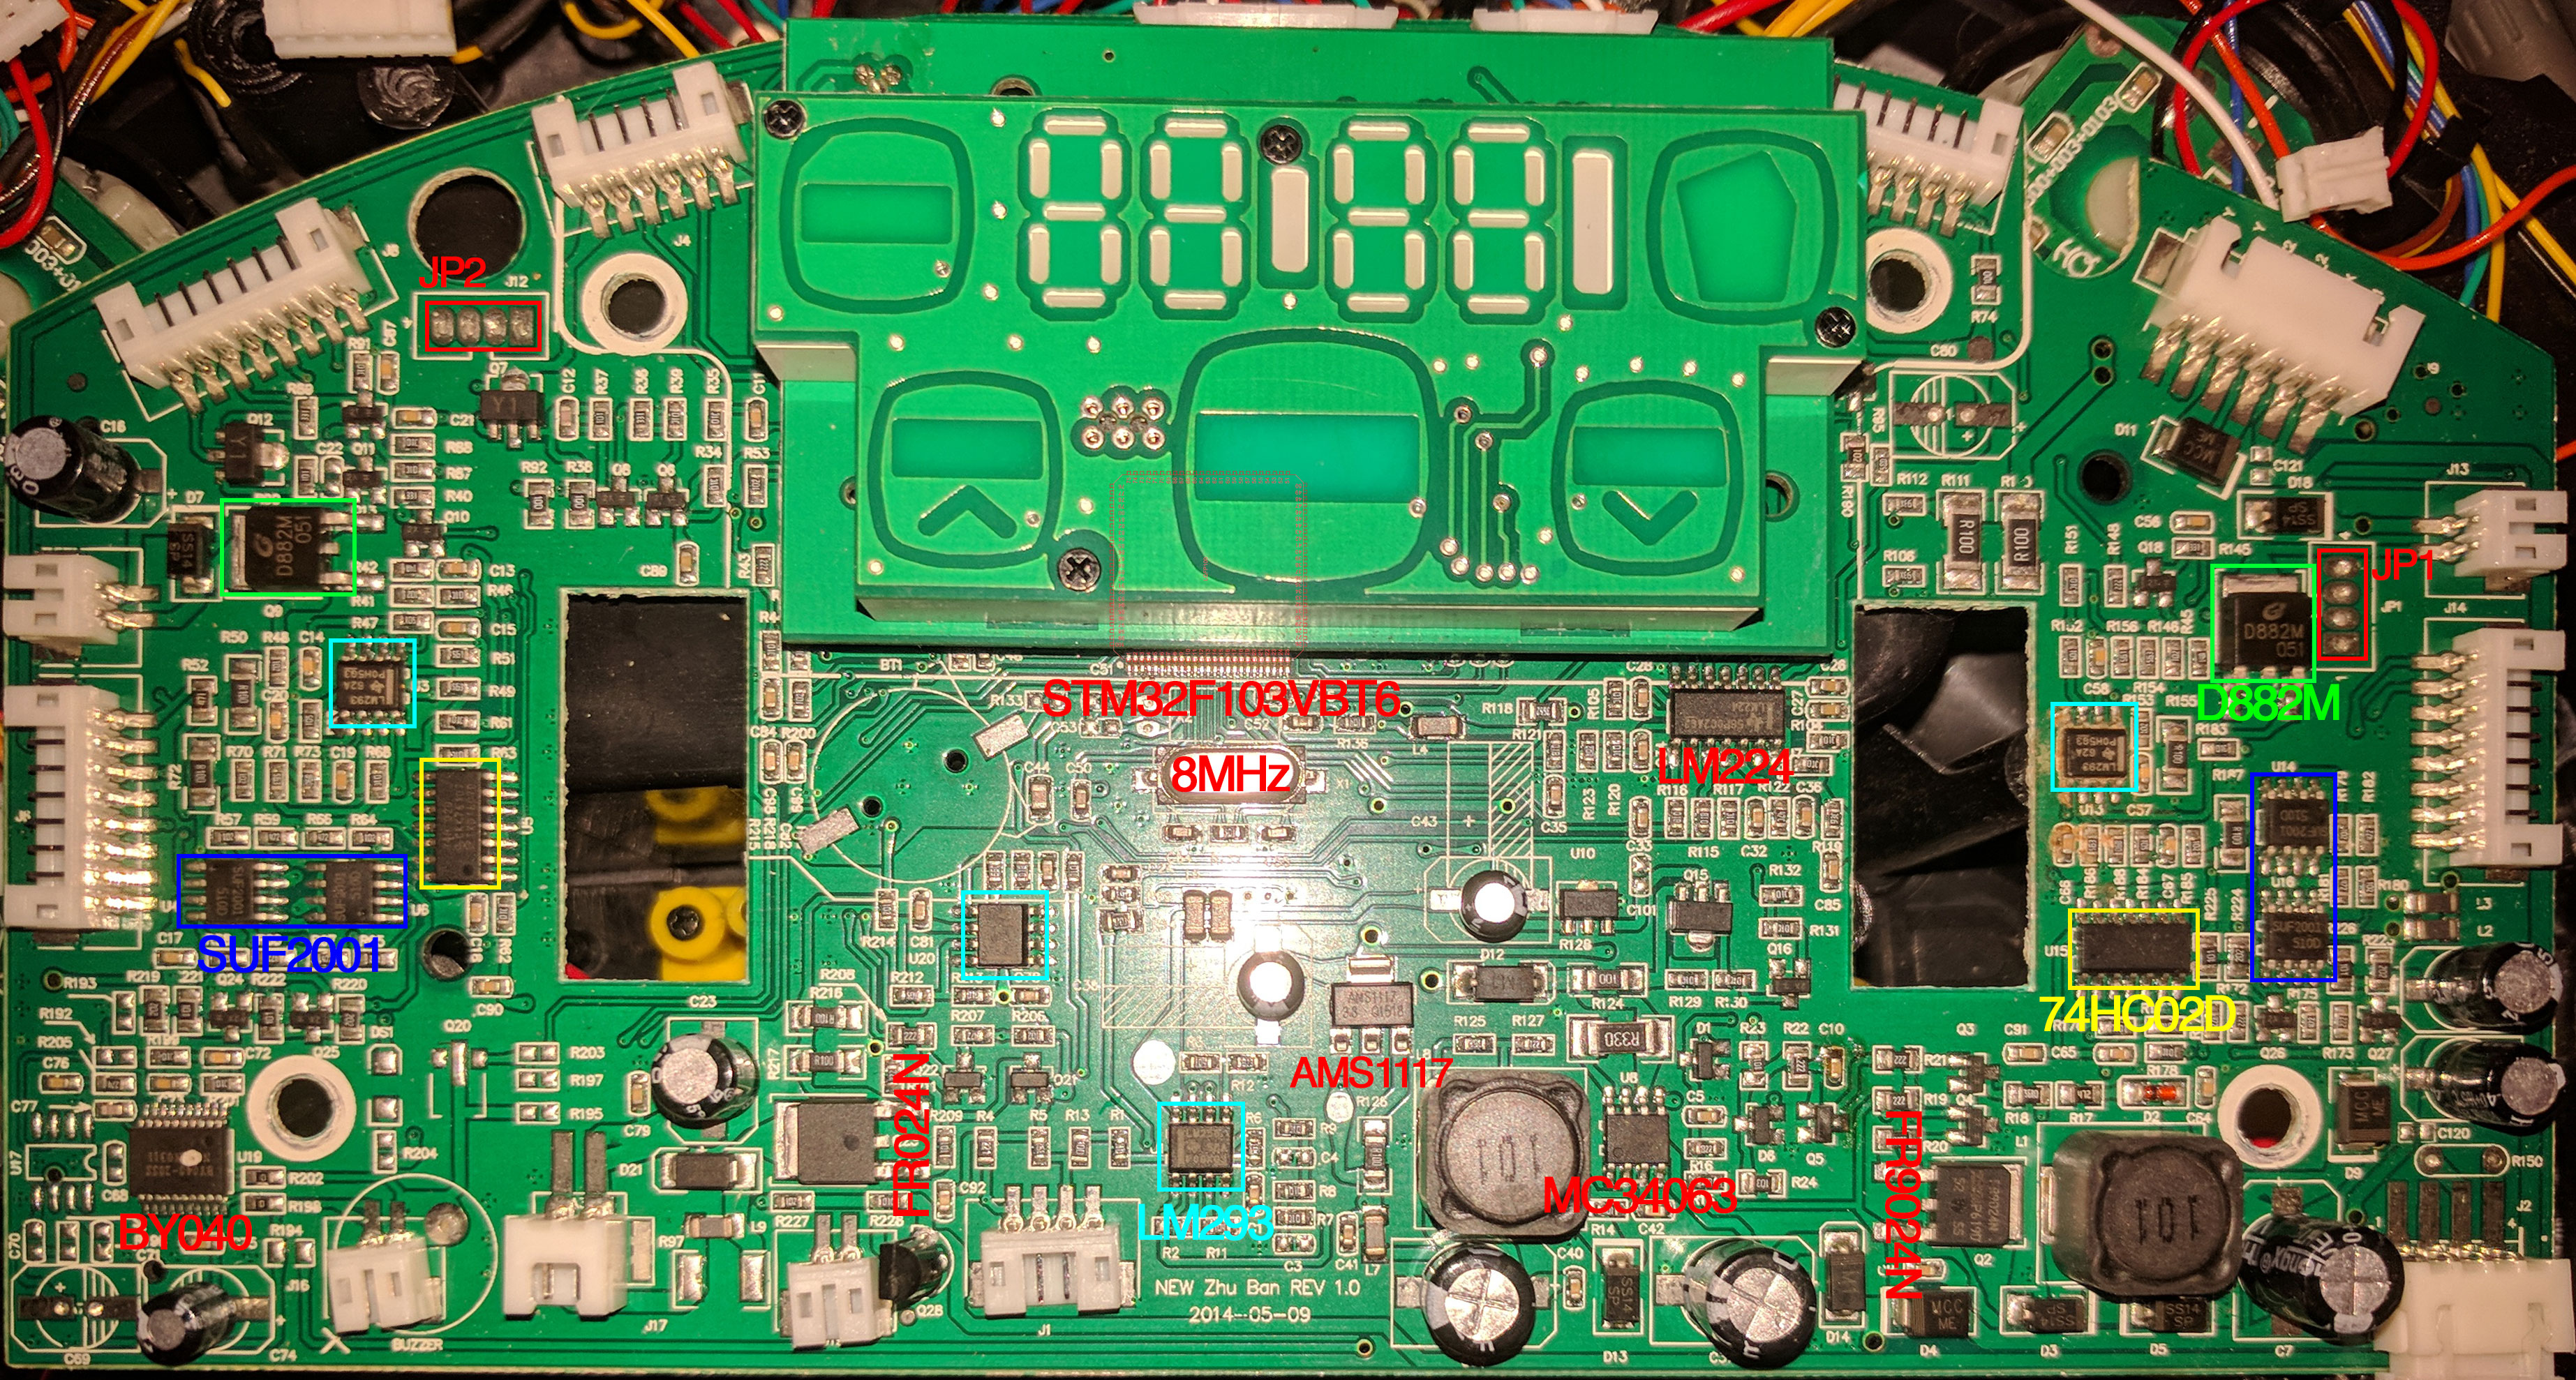
First of all I opened the plastic shell and I inspected the PCB:
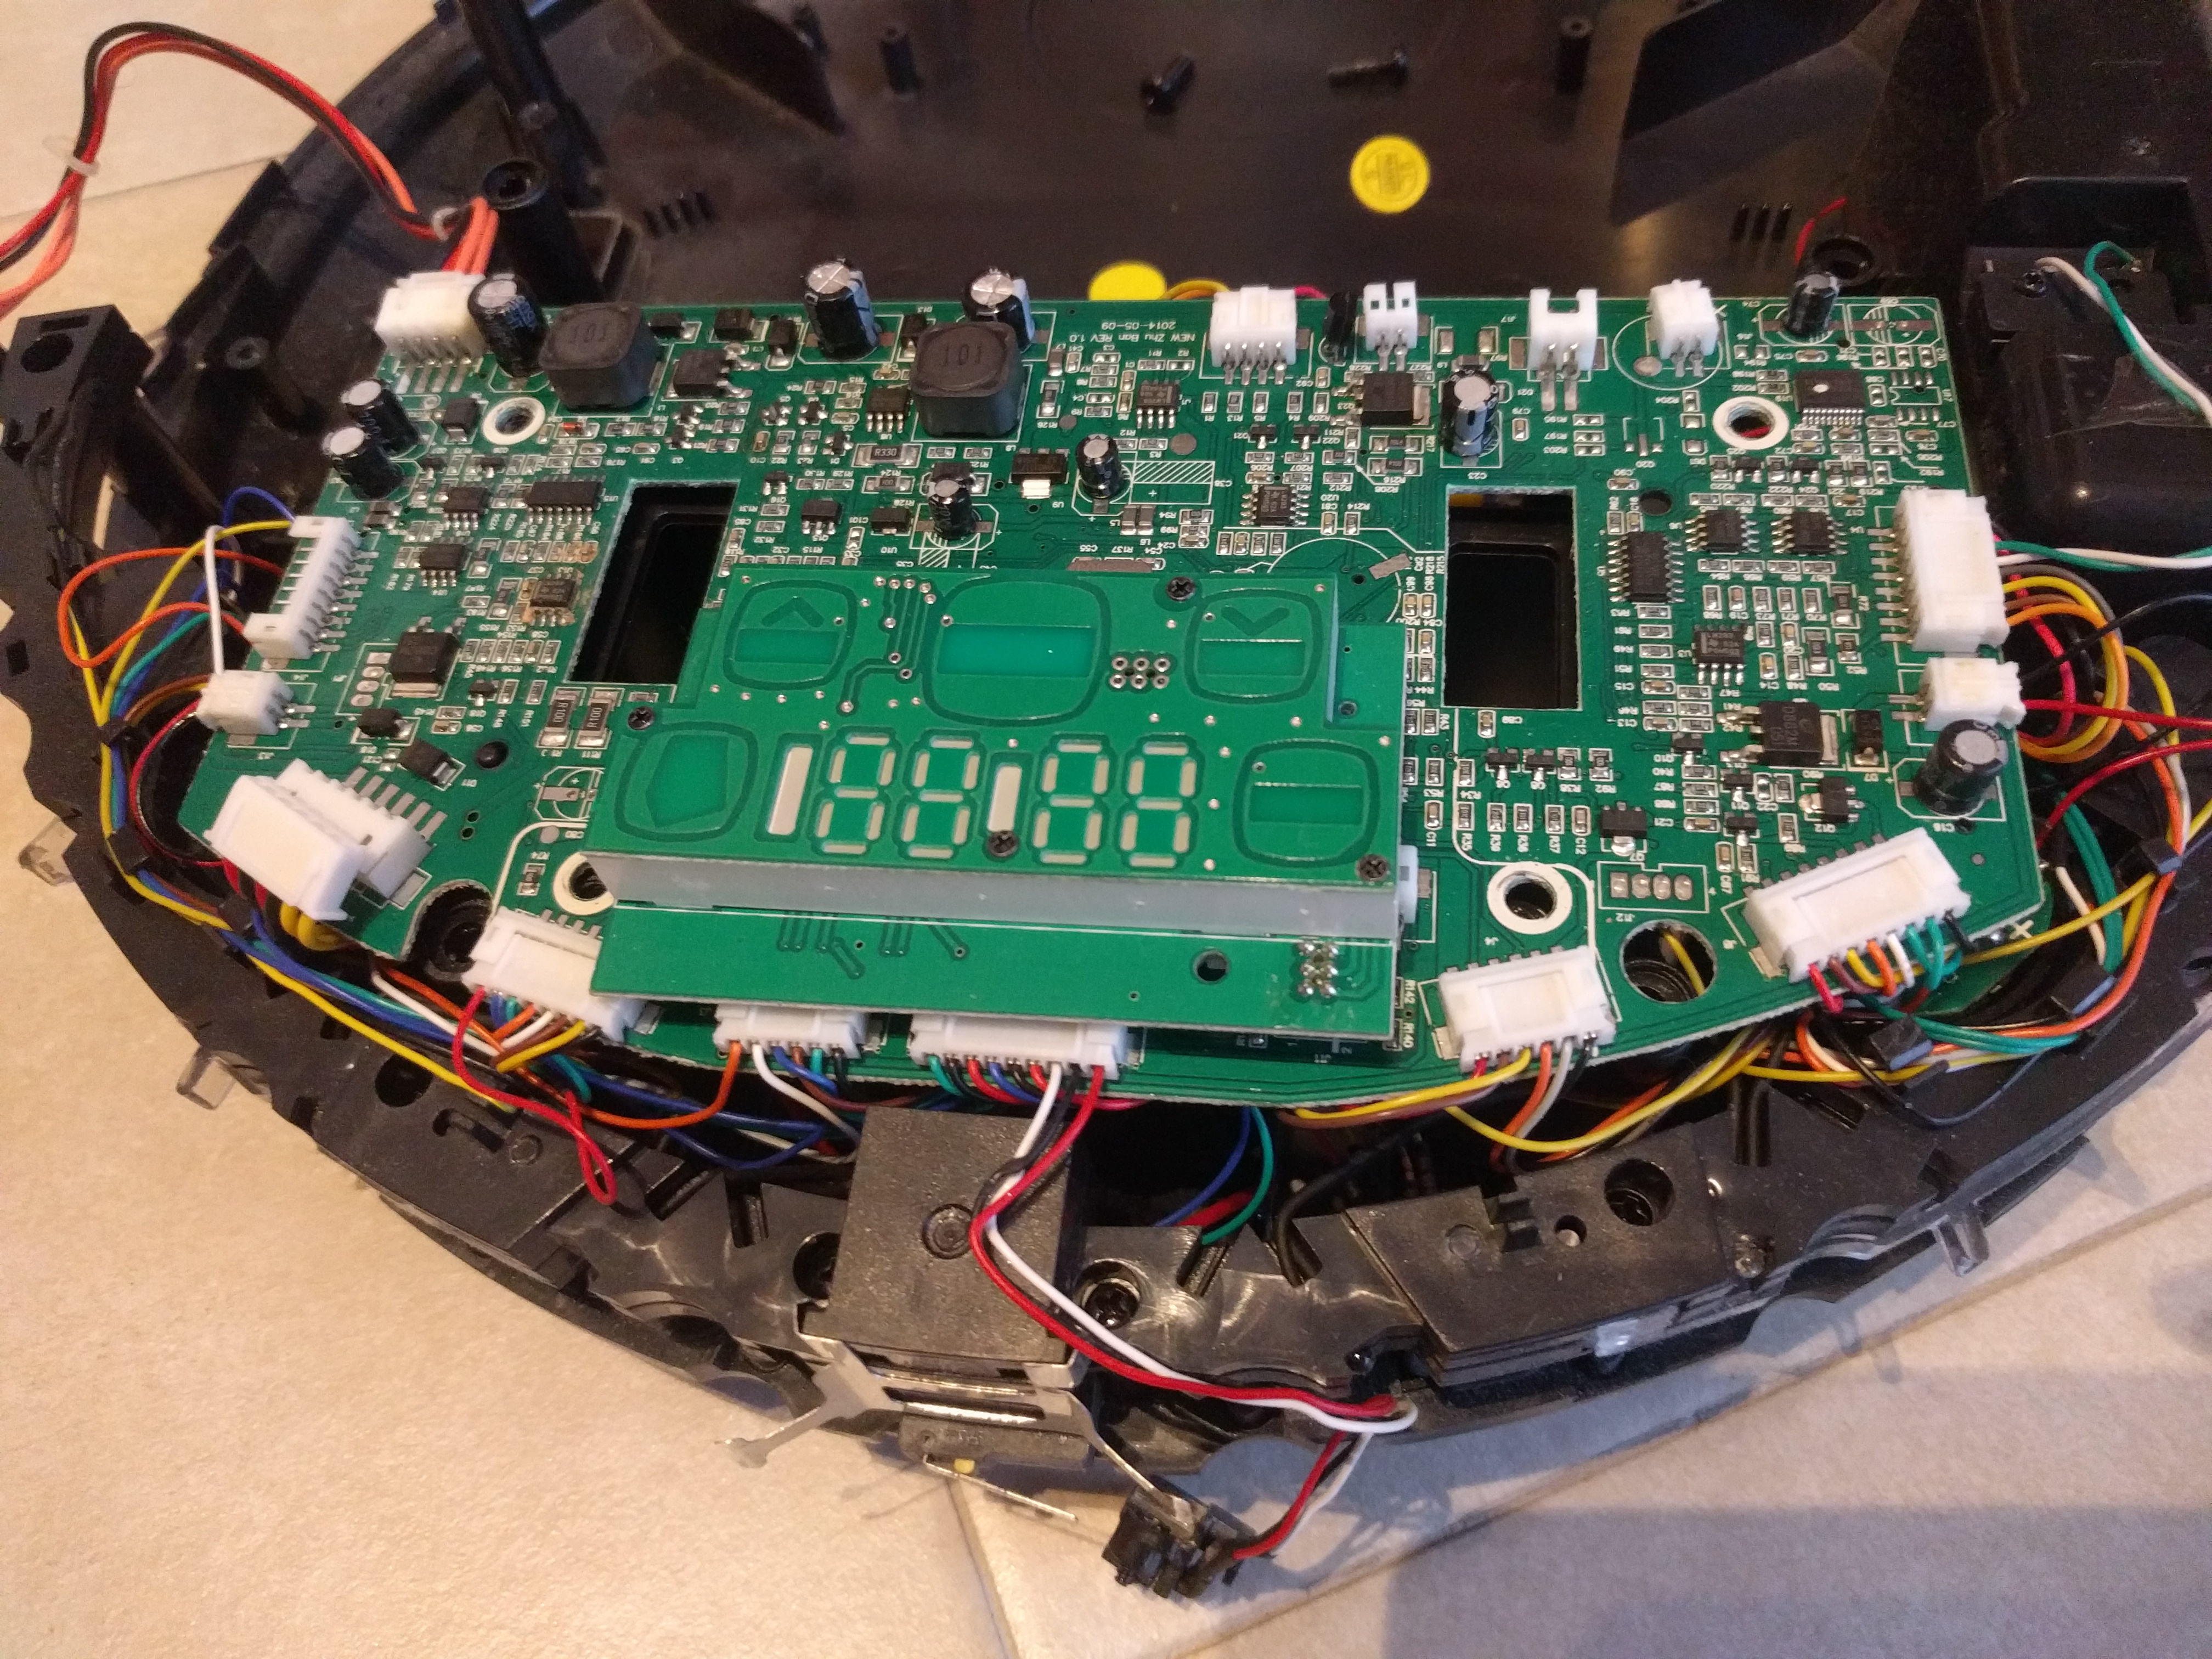
After the inspection, I found the MCU, it is an STM32F103 VBT6 in LQFP100 package, unfortunatly, the MCU is under the screen/touch panel. I don't have any experiences with this MCU, but after Googling I founded a lot of information and seems very commons. There are also many prototype boards.
Wikipadia help me to get some information about the STM32:
STM32 F1 03 V B T6
STM32 xx ww y z
So, the F1 family use a CortexM3 core with 192kB flash.
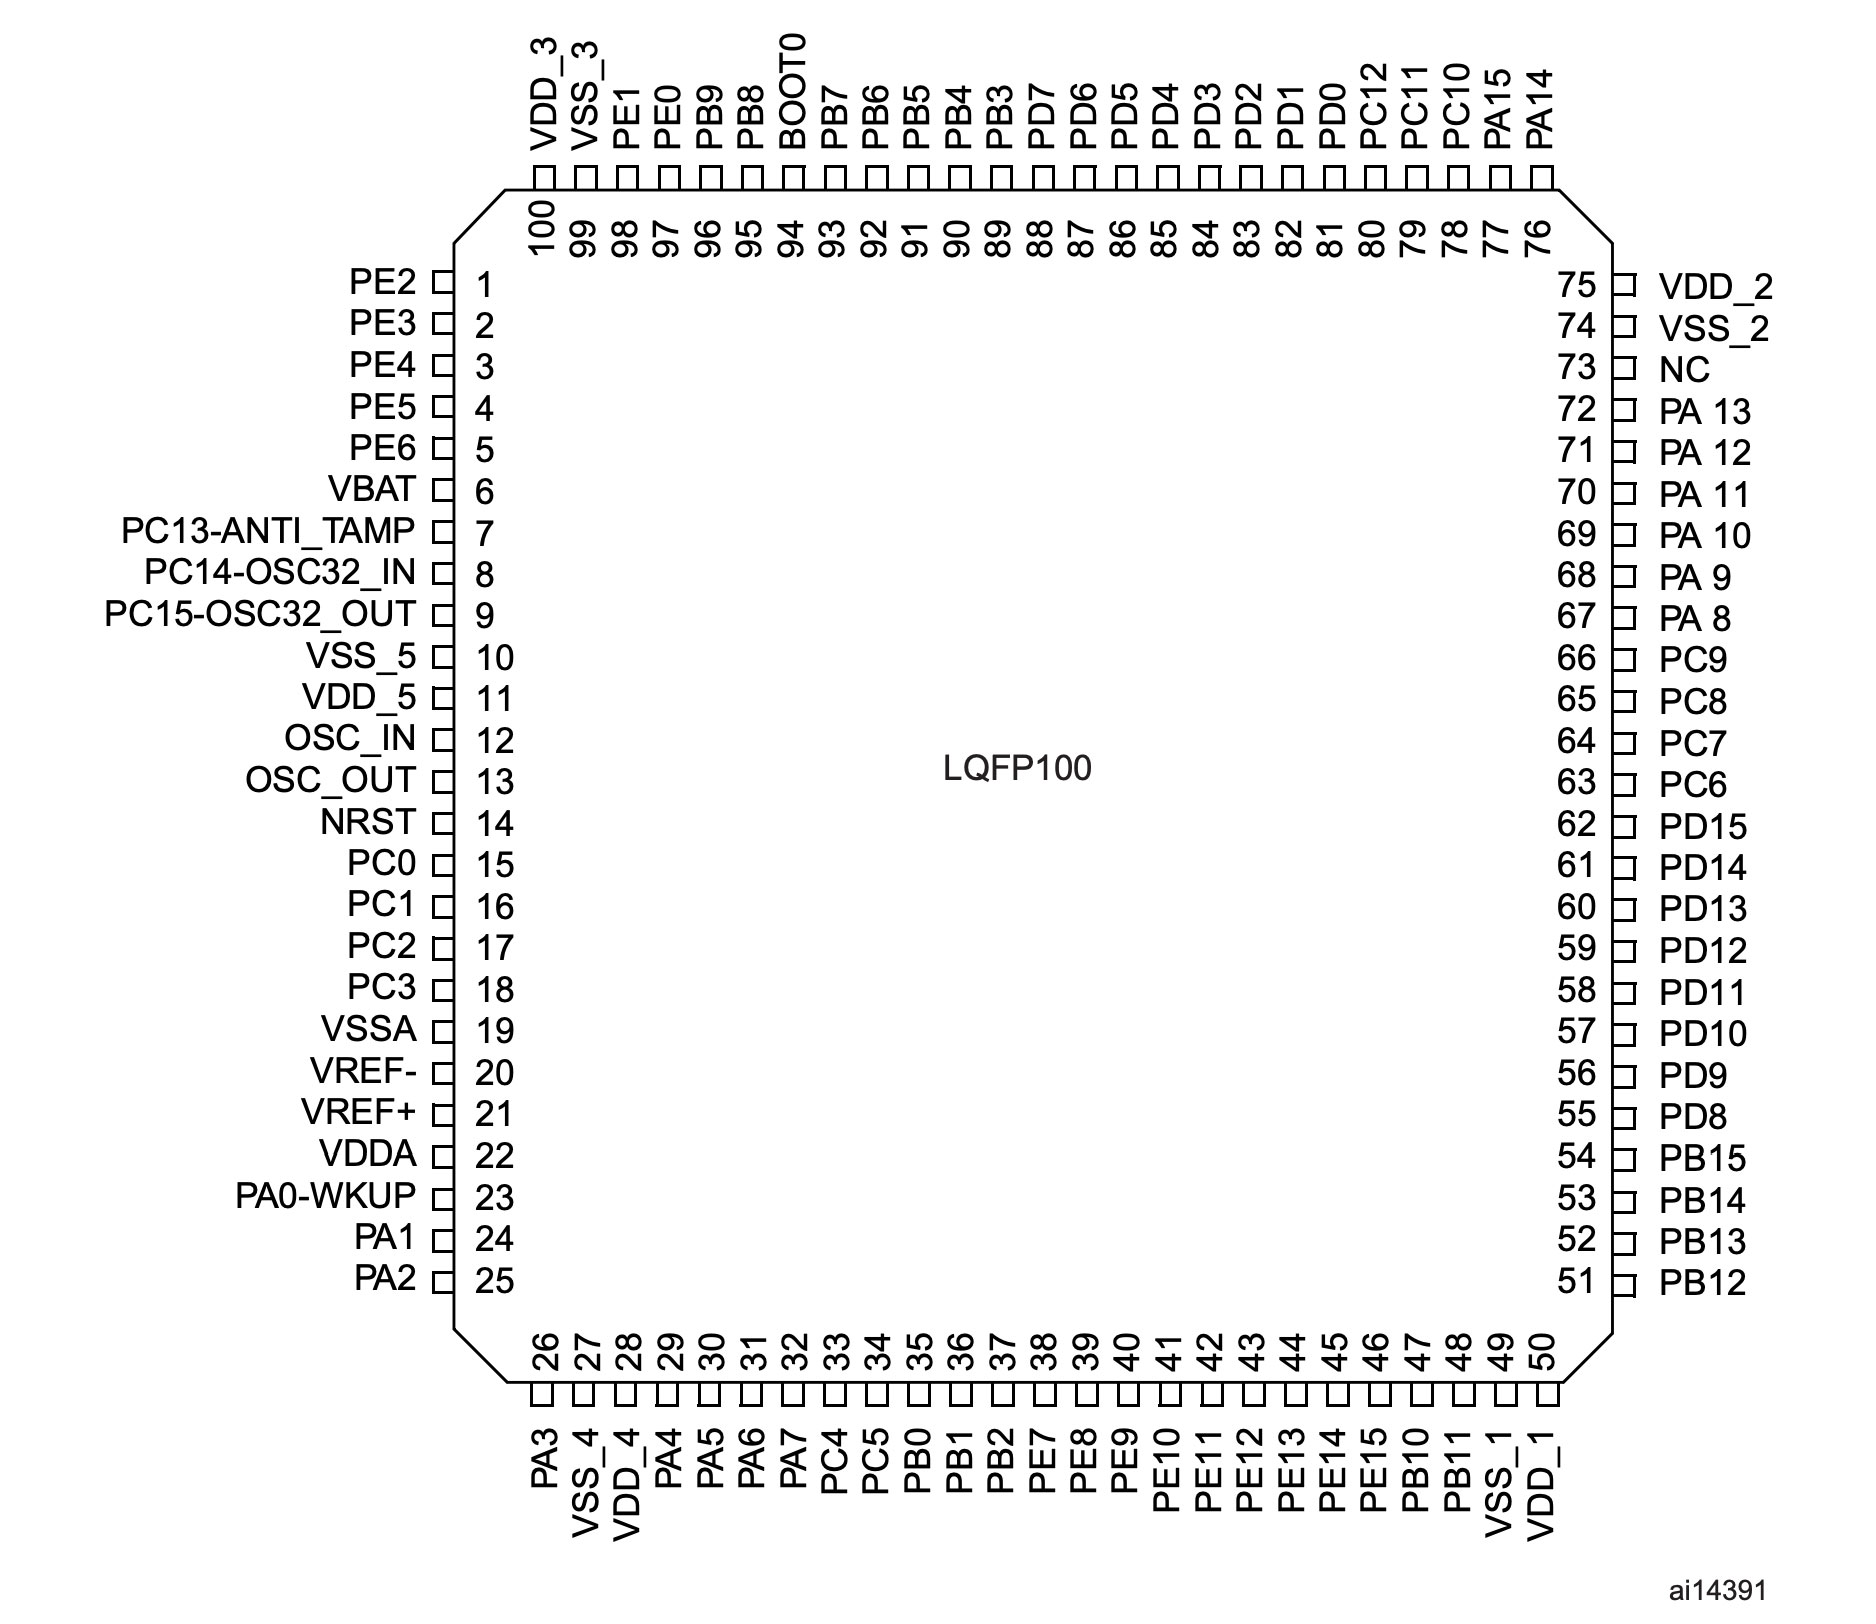
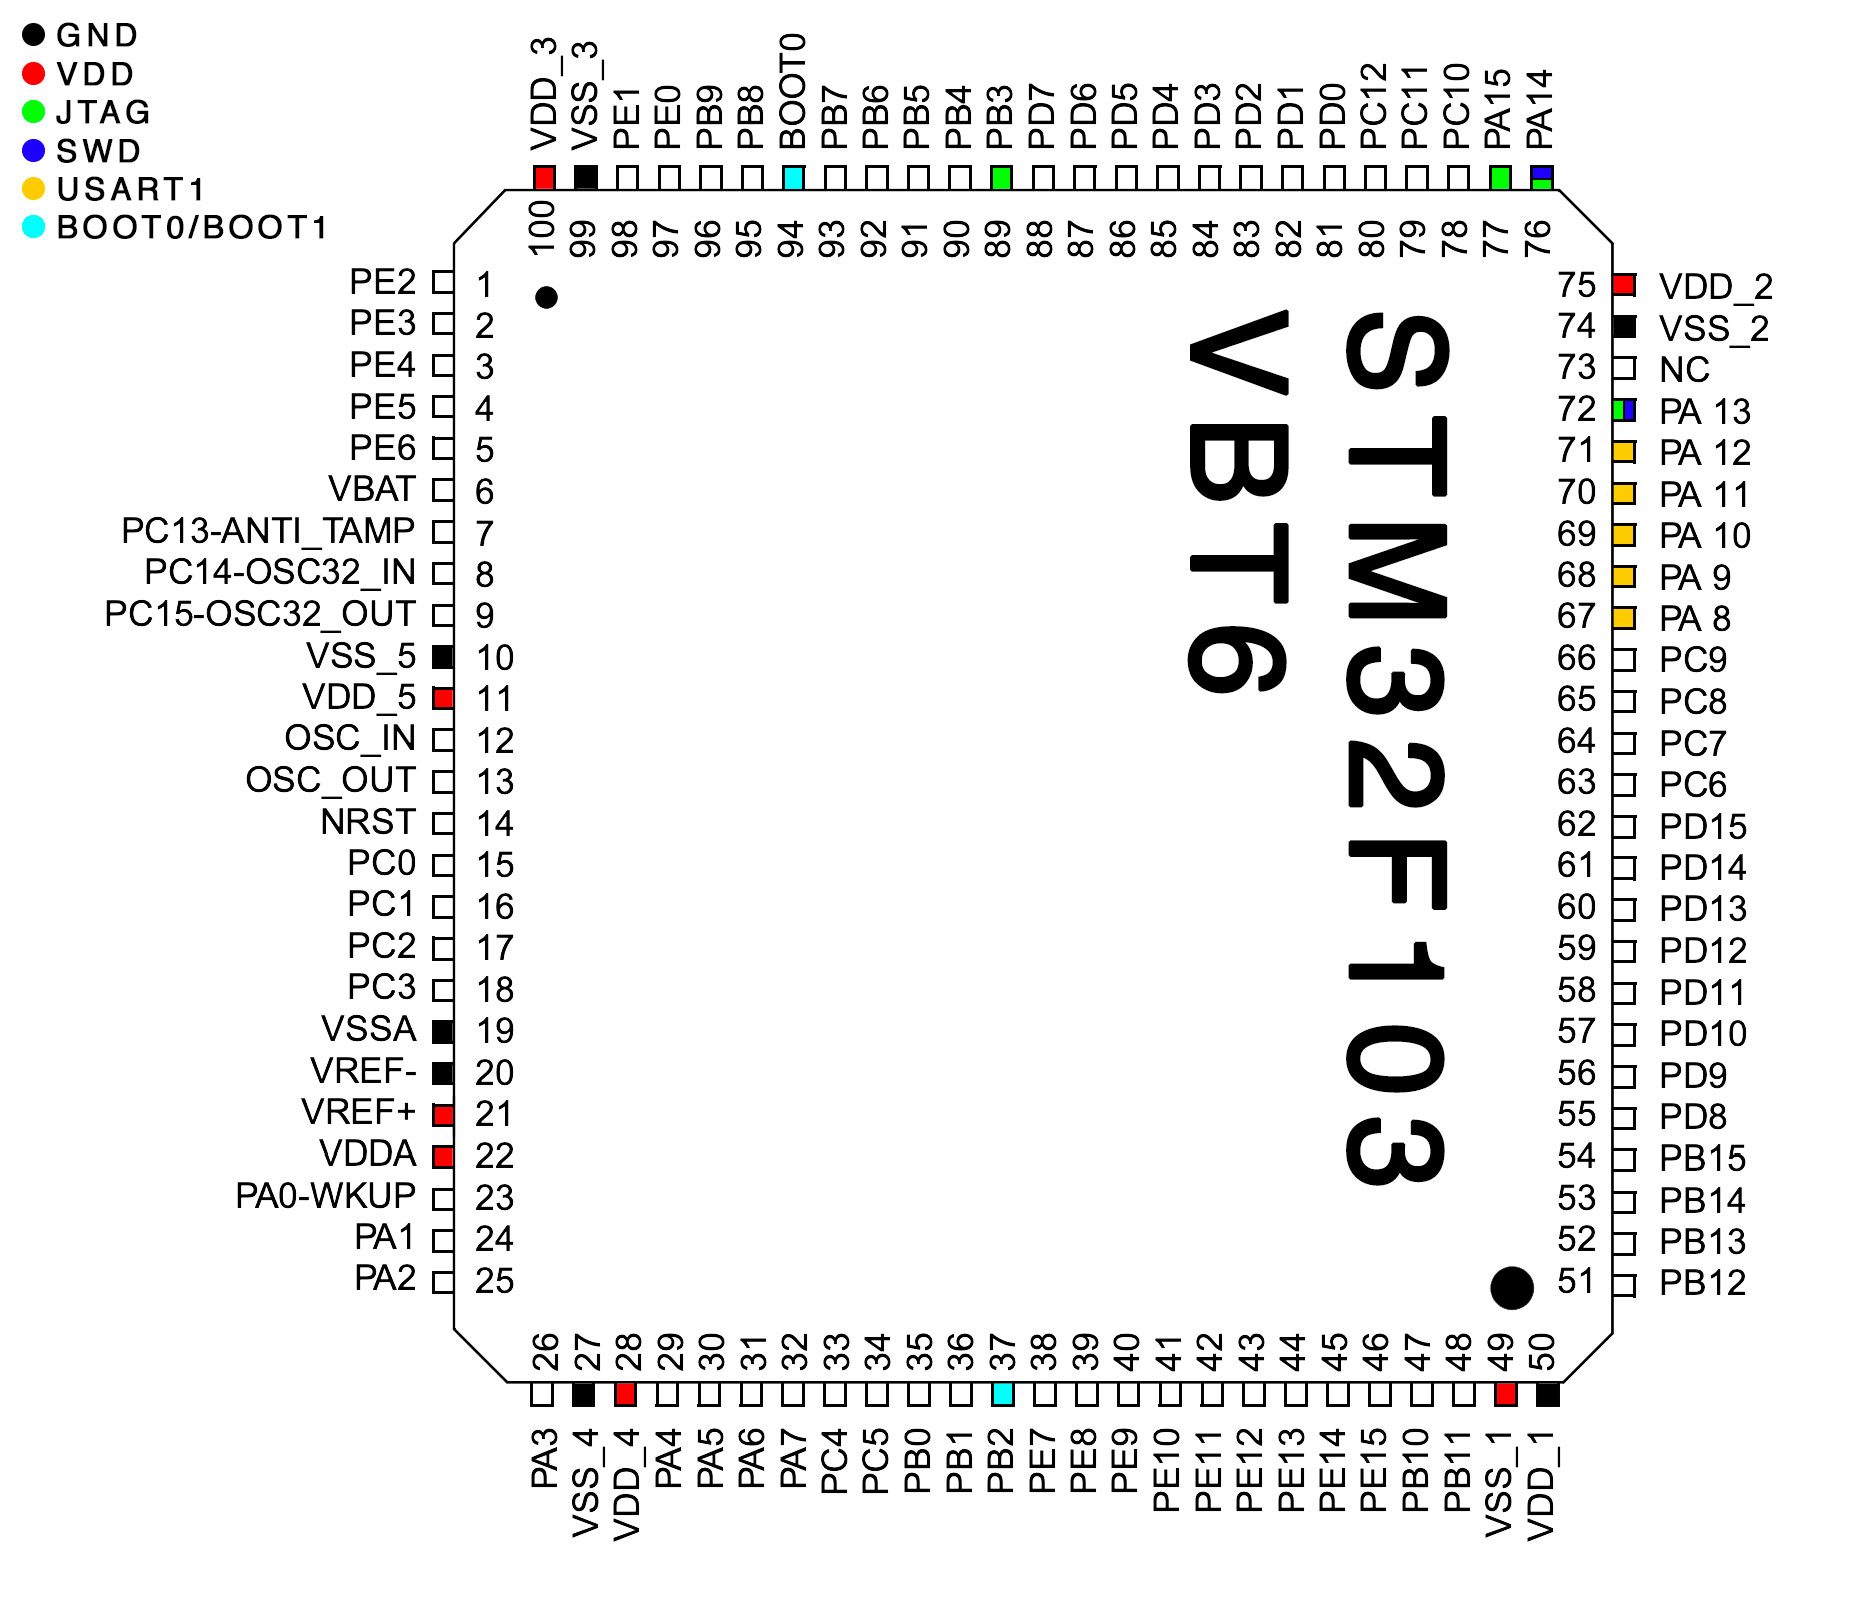
In the datasheet I have find the pinout schema and some interesting pins:
| Pin | Port |
|---|---|
| 37 | PB2 / BOOT1 |
| 37 | PB2 / BOOT1 |
| 67 | PA8 / USART1_CK / TIM1_CH1/MCO |
| 68 | PA9 / USART1_TX / TIM1_CH2 |
| 69 | PA10 / USART1_RX / TIM1_CH3 |
| 70 | PA11 / USART1_CTS / CANRX / USBDM / TIM1_CH4 |
| 71 | PA12 / USART1_RTS / CANTX / USBDP / TIM1_ETR |
| 72 | PA13 / JTMS / SWDIO |
| 76 | PA14 / JTCK / SWCLK |
| 77 | PA15 / JTDI |
| 89 | PB3 / JTDO / TRACESWO |
| 94 | BOOT0 |
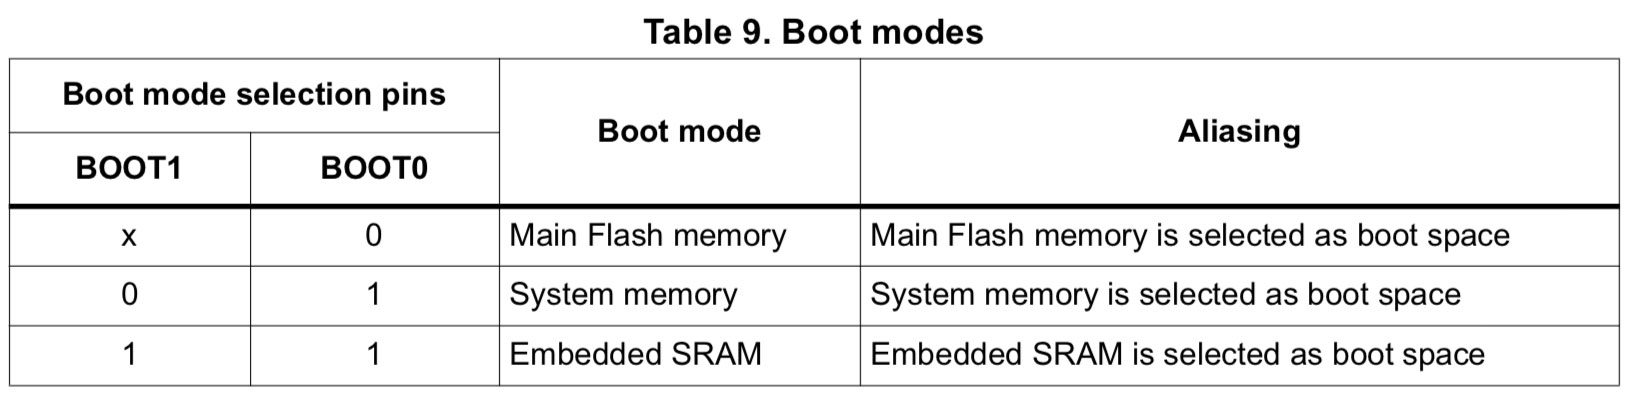
In the STM32F10xxx, 3 different boot modes can be selected through BOOT[1:0] pins:
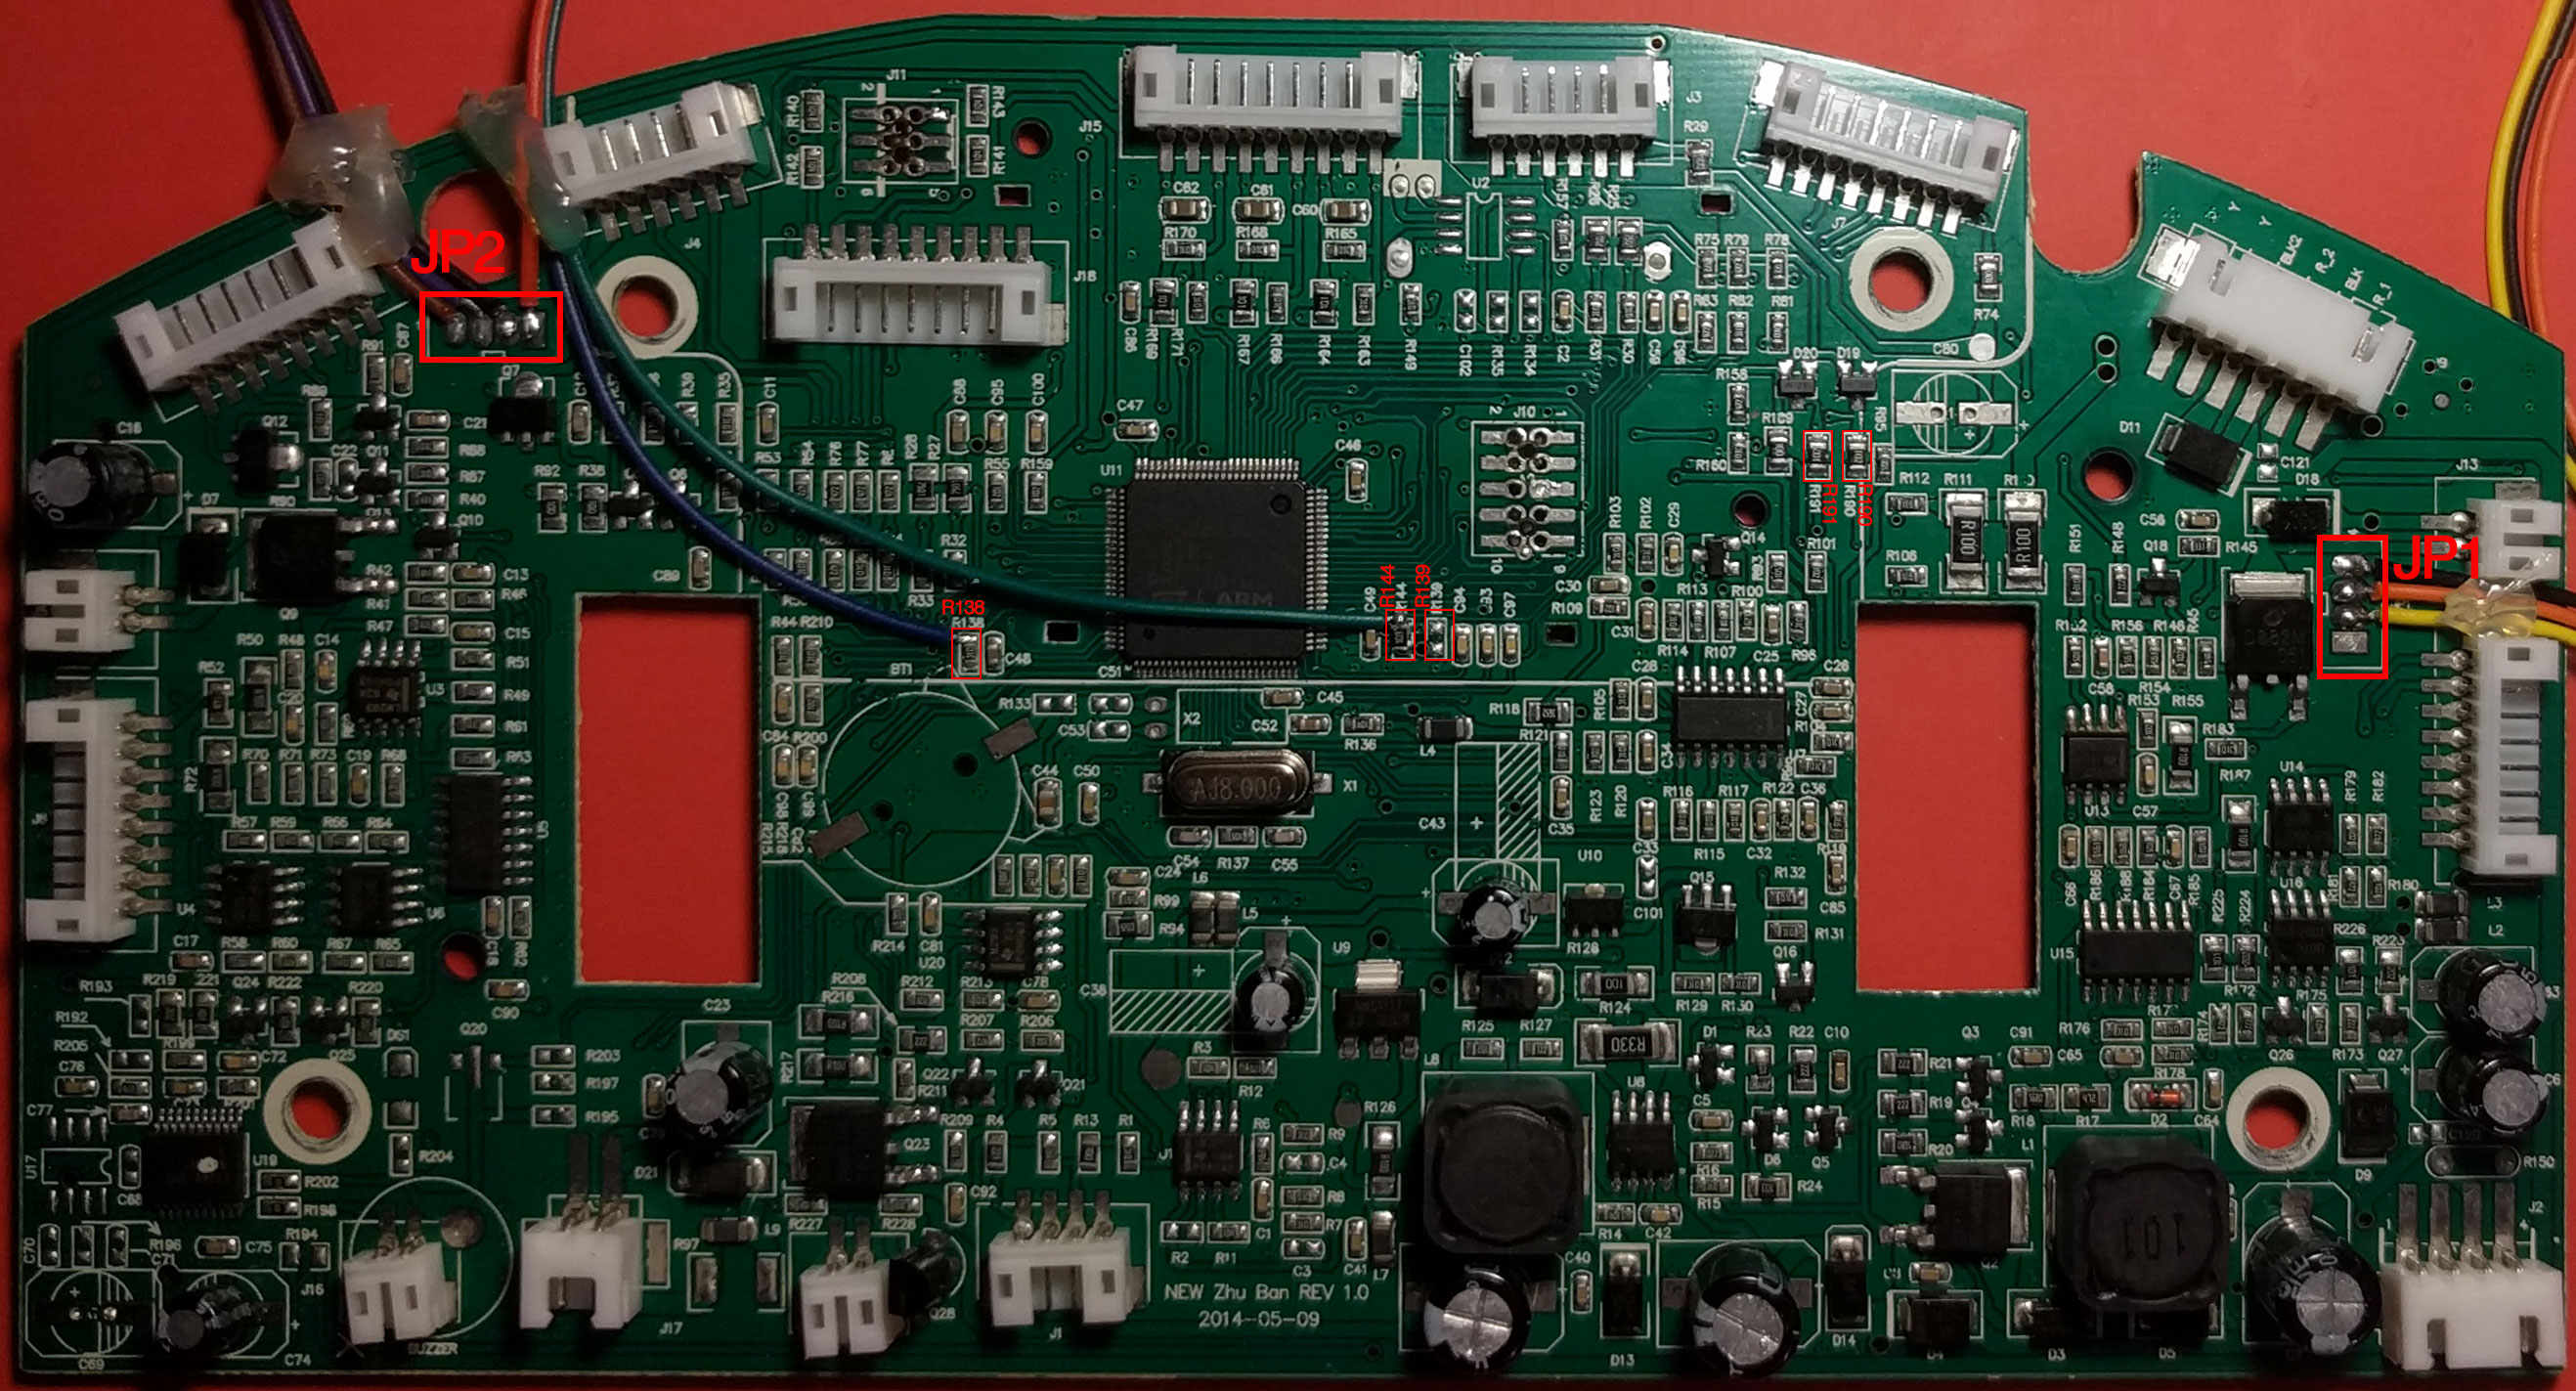
In order to ease the work, I dismounted the PCB from the robot and I found that in the bottom of the board the manufacturer had made a lot of test connection pads:
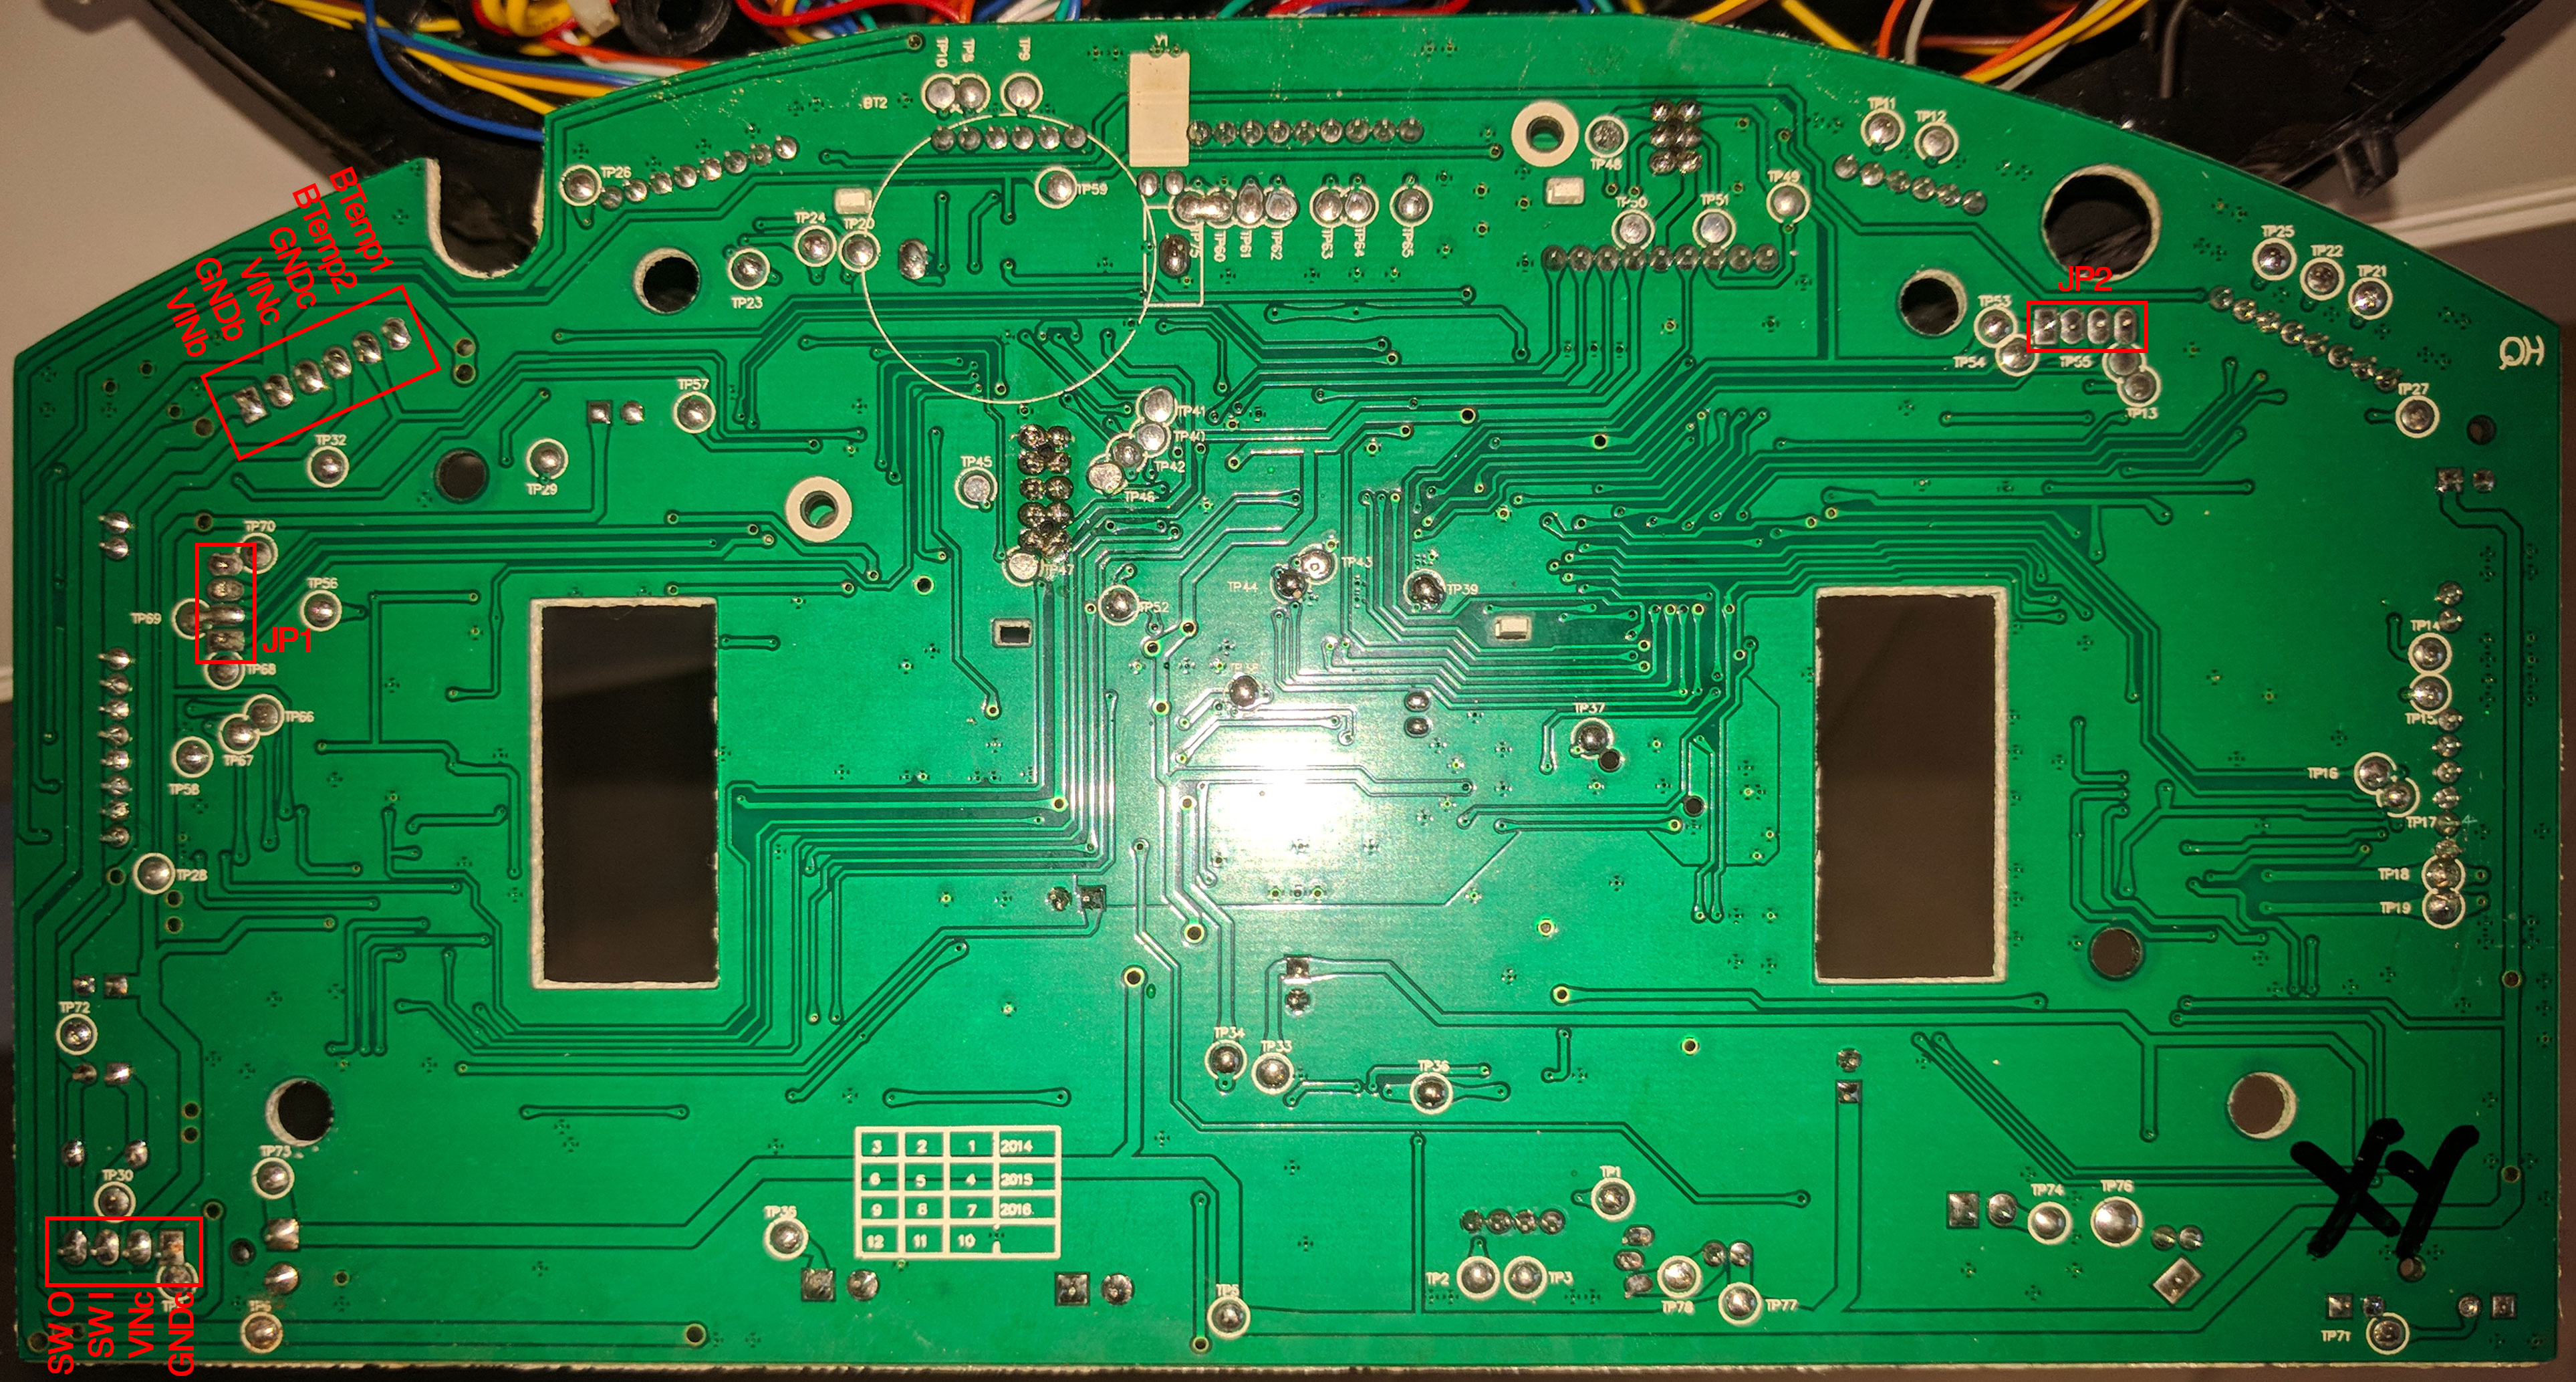
The unsoldered jumpers JP1 and JP2 seems interesting.
So, first of all, I wanted to find GND and VDD pins on the STM32F103. GND reference was easy to find on switch or battery connection, but for VDD I must finded the 3V3 regulator, so I checked all main components of the board and I have searched their datasheet on internet:
| Count | Name | Purpose |
|---|---|---|
| 1 | BY040 | ? |
| 4 | SUF2001 | 30V Dual N- and P-channel Trench MOSFET |
| 4 | LM293 | Dual Comparators |
| 1 | MC34063 | Step−Up/Down/Inverting Switching Regulators |
| 1 | 74HC02D | Quad 2-input NOR gate |
| 1 | LM224 | Quadruple Operational Amplifiers |
| 2 | D882M | General Purpose Transistors |
| 1 | FR9024N | Power MOSFET |
| 1 | FR024N | Power MOSFET |
| 1 | AMS1117 | 1A LOW DROPOUT VOLTAGE REGULATOR (3V3) |
With all the data, I started to investigate the MCU and I checked the accessible GND and VDD pins, but something's not right, the ground position doesn't match the datasheet pinout but, probably, the text over the chip are only tourned of 90°.
I must inspect all pins and, for this purpose, I have unsoldered the control panel. I don't have a lot of experience in unsoldering and I have damaged the pads, but, after this operation, I have access to all pins of the MCU and I have confirmed my hypothesis:
At this time, I took sufficient data to find the SWD, USART1 and BOOT pins over the board. This operation can be done using a multimeter and a lot of patience. Following the tracks of the PCB we can have an idea of the connections and then we can check it with the multimeter short circuit test. Be careful that the PCBs can have many layers (usually 2, top and bottom) and that layers can be connected by VIAs (vertical interconnect access). Tracks and VIAs can be placed under other components.
| Jumper | Pin 1 | Pin 2 | Pin 3 | Pin 4 |
|---|---|---|---|---|
| JP1 | VDD | TX | RX | GND |
| JP2 | VDD | GDN | SWDIO | SWCLK |
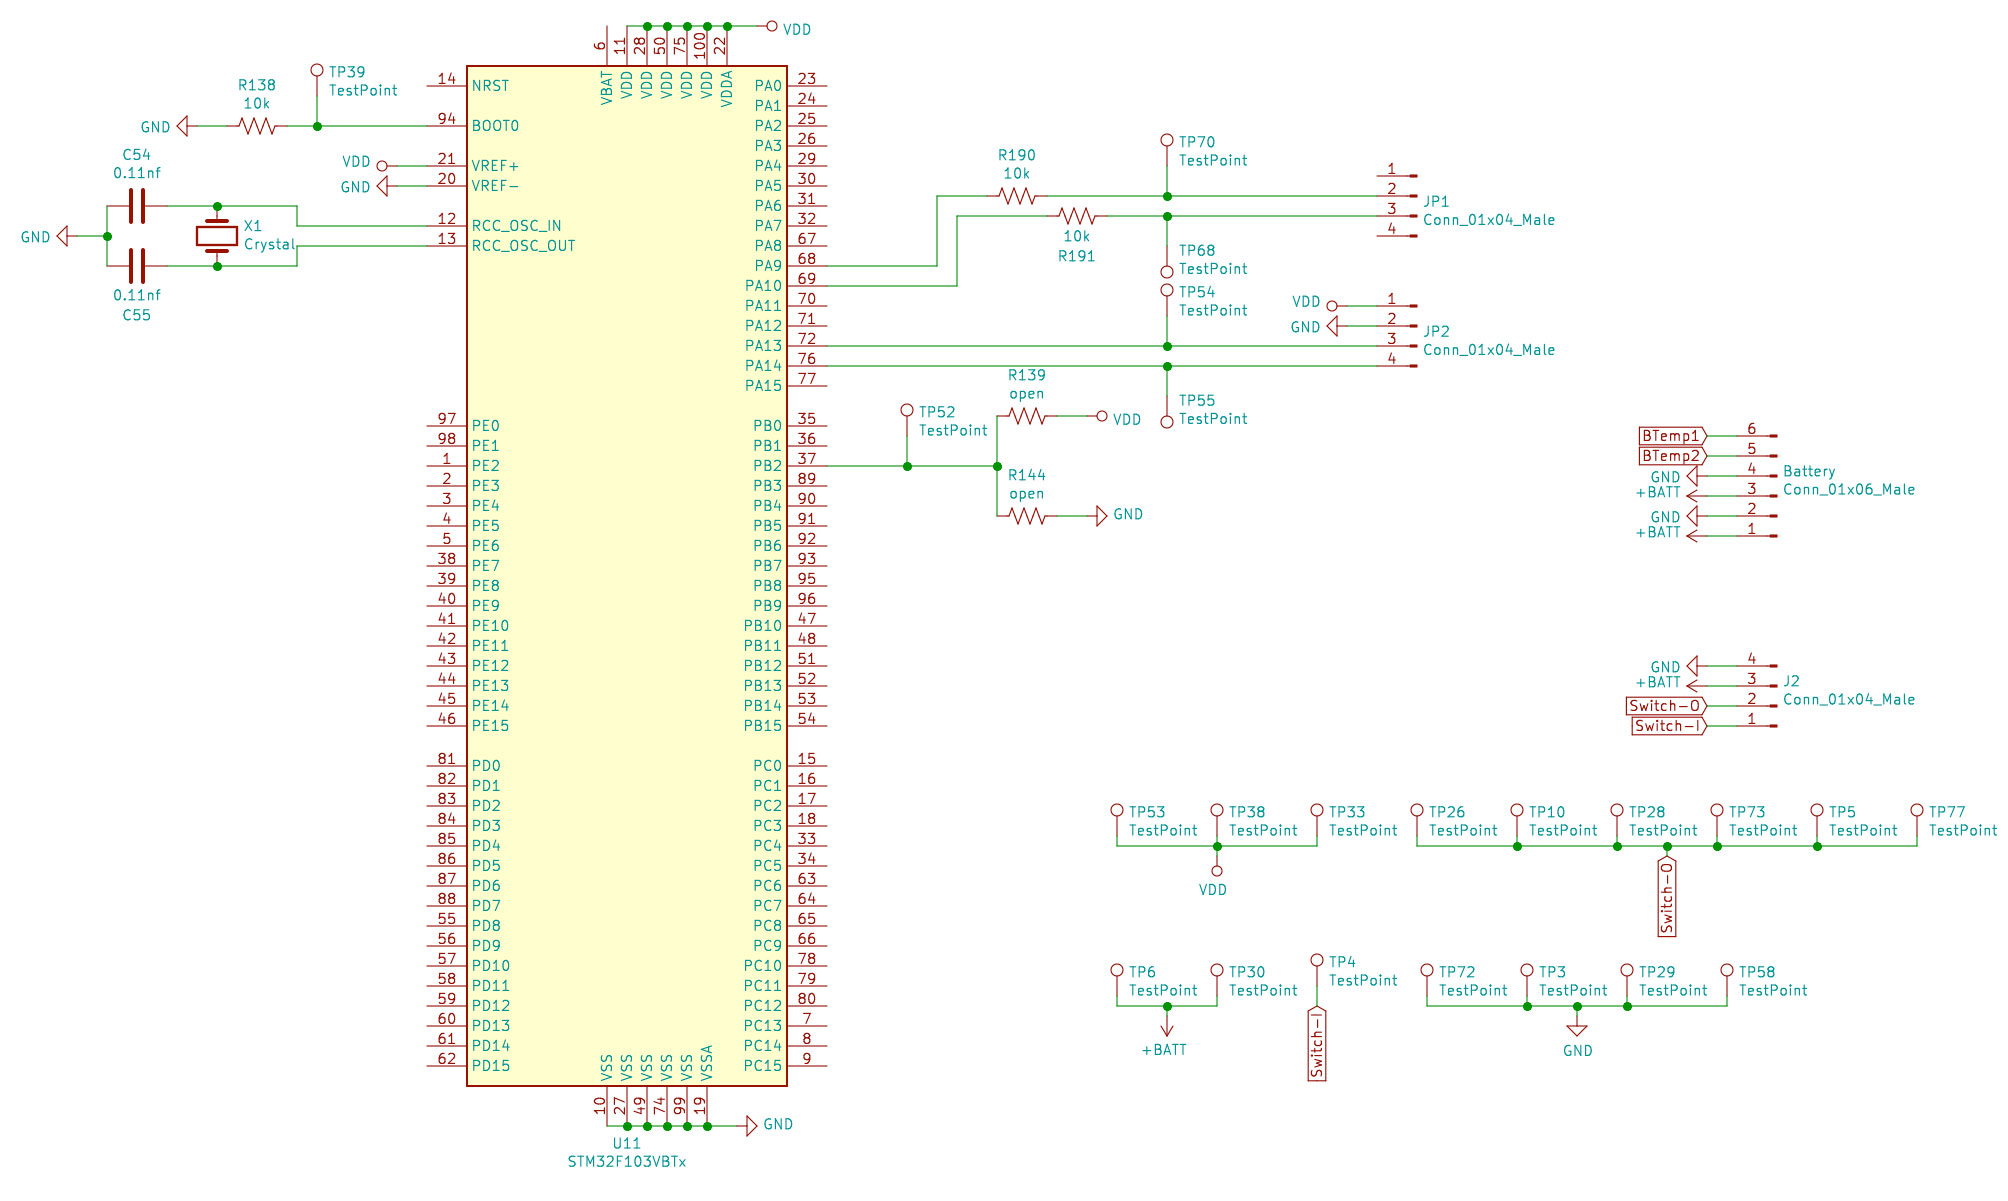
Good, when I have find all I need, I solder some cables for JP1, JP2, BOOT0 and BOOT1. I soldered also the missing R144 resistor (10k) in order to make a boot selector:
I done some tests using the BusPirate w/o succes, but with 9.99€ I can buy an ST-Link V2 for the day after on Amazon. I connected JP2 to the ST-link and ST-Link to may Mac.
I have installed the ST-Link utilities and run st-info --probe:
> st-info --probe                                                                                                                                            ~/Documents/Ciotto/Haier-T32X@MBP-18.local
Found 1 stlink programmers
 serial: 543f6e064966505629660667
openocd: "\x54\x3f\x6e\x06\x49\x66\x50\x56\x29\x66\x06\x67"
  flash: 0 (pagesize: 1024)
   sram: 20480
 chipid: 0x0410
  descr: F1 Medium-density device
BOOM!! It works!
> st-flash read image.bin 0x8000000 1024
st-flash 1.5.1
2018-11-25T21:33:33 INFO common.c: Loading device parameters....
2018-11-25T21:33:33 INFO common.c: Device connected is: F1 Medium-density device, id 0x20036410
2018-11-25T21:33:33 INFO common.c: SRAM size: 0x5000 bytes (20 KiB), Flash: 0 bytes (0 KiB) in pages of 1024 bytes
The device was recognised but, unfortunately, when I tried to dump the firmware, the image file was empty.
This probably means that the MCU have some type of protection enabled.
When debug is disabled still possible to dump the firmware and, after this, we can modify it and reflash, unfortunately this does not seem to be my problem because I can't dump the firmware.
STM32 support 3 protection levels:
Level 0: no read protection
This essentially means that there aren't protection, but can still that Disable Debug was enabled.
Level 1: memory read protection enabled
If a debug access is detected or boot is not set to flash memory area a system fault is generated. Mass-erase is allowed.
Level 2: memory read protection enabled and all debug features disabled.
All protections provided by Level 1, but JTAG/SWD are disabled and chip can't be resetted.
Probably the Read Out protection is setted to Level 1 because i can use SWD but I can't dump the firmware. In ther PentestHardware manual there are some usefull ideas for bypass this protection, but for now i try to inspect the UART.
I also tried using OpenOCD, first of all I runned the server:
> openocd -f haier-t32x.cfg
Open On-Chip Debugger 0.10.0
Licensed under GNU GPL v2
For bug reports, read
    http://openocd.org/doc/doxygen/bugs.html
Info : The selected transport took over low-level target control. The results might differ compared to plain JTAG/SWD
adapter speed: 1000 kHz
adapter_nsrst_delay: 100
none separate
Info : Unable to match requested speed 1000 kHz, using 950 kHz
Info : Unable to match requested speed 1000 kHz, using 950 kHz
Info : clock speed 950 kHz
Info : STLINK v2 JTAG v17 API v2 SWIM v4 VID 0x0483 PID 0x3748
Info : using stlink api v2
Info : Target voltage: 3.516645
Info : stm32f1x.cpu: hardware has 6 breakpoints, 4 watchpoints
And, in other terminal, I opened a connection using telnet:
> telnet localhost 4444
Trying ::1...
telnet: connect to address ::1: Connection refused
Trying 127.0.0.1...
Connected to localhost.
Escape character is '^]'.
Open On-Chip Debugger
> flash probe 0
device id = 0x20036410
STM32 flash size failed, probe inaccurate - assuming 128k flash
flash size = 128kbytes
flash 'stm32f1x' found at 0x08000000
> dump_image image.bin 0x08000000 0x20000

>
Is also possible to use GDB:
> ./arm-none-eabi-gdb
GNU gdb (GNU Tools for Arm Embedded Processors 7-2018-q2-update) 8.1.0.20180315-git
Copyright (C) 2018 Free Software Foundation, Inc.
License GPLv3+: GNU GPL version 3 or later <http://gnu.org/licenses/gpl.html>
This is free software: you are free to change and redistribute it.
There is NO WARRANTY, to the extent permitted by law.  Type "show copying"
and "show warranty" for details.
This GDB was configured as "--host=x86_64-apple-darwin10 --target=arm-none-eabi".
Type "show configuration" for configuration details.
For bug reporting instructions, please see:
<http://www.gnu.org/software/gdb/bugs/>.
Find the GDB manual and other documentation resources online at:
<http://www.gnu.org/software/gdb/documentation/>.
For help, type "help".
Type "apropos word" to search for commands related to "word".
(gdb) target remote localhost:3333
Remote debugging using localhost:3333
warning: No executable has been specified and target does not support
determining executable automatically.  Try using the "file" command.
0x0800018c in ?? ()
(gdb) dump binary memory image.bin 0x08000000 0x08001000
Unfortunately I get poor results with the SWD interface, so I start to inspect the UART.
I attached my USB-to-Serial interface, I runned miniterm with most used baud rate and I reboot the board:
> python -m serial.tools.miniterm /dev/tty.usbserial-A50285BI 115200
--- Miniterm on /dev/tty.usbserial-A50285BI  115200,8,N,1 ---
--- Quit: Ctrl+] | Menu: Ctrl+T | Help: Ctrl+T followed by Ctrl+H ---
怆�����x<f<␀x␃̆�␀x␏���f<␆<������~<␀x␌���␘<��`?���␀x␀��␆<������~<␀x�φ�x<f<␀x␌�f<`?`?f<␘?␆␌��怘��␘0␆<␞?f<������f<␞0f?␘?␘?f<��`?␀x�x␀�␀�␆␏␘␏␘␏���␘0␆<`?`?f<␘?�␞␀x<�����`?␆<~<f<␀x�x␀�␆␏f␏�x<�
Well, something happened. After some try with other common used baud rate, I got the out put:
> python -m serial.tools.miniterm /dev/tty.usbserial-A50285BI 57600
--- Miniterm on /dev/tty.usbserial-A50285BI  57600,8,N,1 ---
--- Quit: Ctrl+] | Menu: Ctrl+T | Help: Ctrl+T followed by Ctrl+H ---
Ilife AI Cleaning Robot
  Making life better!

BaseLineCurrent = 0122
Battery Voltage = 1596
Good, this is the confirmation that this robot is produced by ILife.
When I tried to start the board with BOOT0 to 3V3 there was no output, so probably this confirm that the Read Out protection is setted to Level 1 or Level 2.
When I attached the charger, the robot logged Charge Start over serial, but when I press buttons over IR remote or send command with the UART, nothing is happening.
The Master (aka Gipi) shared with me a link about dumping ARM Cortex-M0 firmware through the MCU's registers, the STM32 F1 subserie use a ARM Cortex-M3 core but in theory can work.
The idea is to use the debugger in order to single-step the execution of code, I can't see the code, but code must to be executed and some operation require to read the memory into a register.
Find this operation require some try, we can set all the registers to 0x0, do some a step until a register change and retry this line with all the registers set to 0x4. If the value in the register is different and the delta is not 4, we probably finded an operation tha read the memory. The confirm can be reached using this command to read itself and than we can disassembles it.
So, let's try to single-step the code execution:
> reset halt
target halted due to debug-request, current mode: Thread
xPSR: 0x01000000 pc: 0x0800018c msp: 0x20000728
> step
target halted due to single-step, current mode: Handler HardFault
xPSR: 0x01000003 pc: 0x08002264 msp: 0x20000708
halted: PC: 0x08002264
> reg
===== arm v7m registers
(0) r0 (/32): 0x20000007
(1) r1 (/32): 0x00000002
(2) r2 (/32): 0x00000040
(3) r3 (/32): 0x04000000
(4) r4 (/32): 0x20000005
(5) r5 (/32): 0x40011000
(6) r6 (/32): 0x40010000
(7) r7 (/32): 0x00000000
(8) r8 (/32): 0x000003E8
(9) r9 (/32): 0x20000005
(10) r10 (/32): 0x000003E8
(11) r11 (/32): 0x00000000
(12) r12 (/32): 0x20000104
(13) sp (/32): 0x20000708
(14) lr (/32): 0xFFFFFFF9
(15) pc (/32): 0x08002264
(16) xPSR (/32): 0x01000003
(17) msp (/32): 0x20000708
(18) psp (/32): 0xCEEBC0F0
(19) primask (/1): 0x00
(20) basepri (/8): 0x00
(21) faultmask (/1): 0x00
(22) control (/2): 0x00
===== Cortex-M DWT registers
(23) dwt_ctrl (/32)
(24) dwt_cyccnt (/32)
(25) dwt_0_comp (/32)
(26) dwt_0_mask (/4)
(27) dwt_0_function (/32)
(28) dwt_1_comp (/32)
(29) dwt_1_mask (/4)
(30) dwt_1_function (/32)
(31) dwt_2_comp (/32)
(32) dwt_2_mask (/4)
(33) dwt_2_function (/32)
(34) dwt_3_comp (/32)
(35) dwt_3_mask (/4)
(36) dwt_3_function (/32)
>
Ok, well but not very well, I can do reset and halt, I can read registers but when I do a single-step the execution fall in Handler HardFault.
However, I tried to write a Python script that automatically search a valid operation. This script set PC register to a specific address, reset general purpose registers and single-step the operation, after this check the changes on the registers.
> python scripts/firmware_dump.py search -a 0x0800018c
Search command..
Try with address 0x8000250
Skip sum operation
Try with address 0x800025a
Skip sum operation
...
Try with address 0x8009138
Skip sum operation
Try with address 0x805289e
I run my script from the reset address but after a lot of time I found nothing, so probably this solution doesn't work in my case.
> telnet localhost 4444
Trying ::1...
telnet: connect to address ::1: Connection refused
Trying 127.0.0.1...
Connected to localhost.
Escape character is '^]'.
Open On-Chip Debugger
> reset halt
target halted due to debug-request, current mode: Thread
xPSR: 0x01000000 pc: 0x0800018c msp: 0x20000728
> step
target halted due to single-step, current mode: Handler HardFault
xPSR: 0x01000003 pc: 0x08002264 msp: 0x20000708
halted: PC: 0x08002264
> stm32f1x unlock 0
device id = 0x20036410
flash size = 128kbytes
target halted due to breakpoint, current mode: Handler HardFault
xPSR: 0x61000003 pc: 0x2000003a msp: 0xffffffdc
stm32x unlocked.
INFO: a reset or power cycle is required for the new settings to take effect.
> flash probe 0
device id = 0x20036410
flash size = 128kbytes
flash 'stm32f1x' found at 0x08000000
> dump_image image.bin 0x08000000 0x20000
dumped 131072 bytes in 2.915196s (43.908 KiB/s)
>
Command: stm32f1x unlock num
Unlocks the entire stm32 device for reading. This command will cause a mass erase of the entire stm32 device if previously locked. The num parameter is a value shown by flash banks.
> telnet localhost 4444
Trying ::1...
telnet: connect to address ::1: Connection refused
Trying 127.0.0.1...
Connected to localhost.
Escape character is '^]'.
Open On-Chip Debugger
> reset halt
target halted due to debug-request, current mode: Thread
xPSR: 0x01000000 pc: 0xfffffffe msp: 0xfffffffc
> flash write_image erase uart.bin  0x08000000
auto erase enabled
target halted due to breakpoint, current mode: Thread
xPSR: 0x61000000 pc: 0x2000003a msp: 0xfffffffc
no flash bank found for address 8020000
wrote 131072 bytes from file uart.bin in 3.950422s (32.402 KiB/s)
> shutdown
shutdown command invoked
Connection closed by foreign host.